Connecting to the BTCUSDT order book…
70% offLaunch prices, a 7-day free trial, or $0 with a partner broker

Watch the order book move.

HeatCharting paints every resting buy and sell order behind the price, so you can see where size is waiting, when it gets pulled and who is pushing. Built by a real, profitable trader, for traders.

Open charts

Still trading with indicators built in the 1970s?

Moving averages and RSI only describe what already happened. Price moves because orders hit liquidity. If you cannot see the orders, you are trading the shadow, not the thing that casts it. The traders taking your money can see the order book. Now you can too.

Trading the old way

  • Drawing support from a swing low that happened last week
  • Waiting for an indicator to cross after the move is over
  • Buying a breakout that was never real and getting trapped
  • Guessing why price stopped dead at a level
  • Reading one candle every five minutes

Trading with HeatCharting

  • Seeing the bids that are actually resting there right now
  • Watching aggressive buyers lift the offer as it happens
  • Seeing the wall get pulled before price ever reaches it
  • Spotting absorption: size eaten at one price while it refuses to move
  • Reading every trade, at every price, every second

Six things a candle will never show you.

This is what professional order-flow traders watch all day. HeatCharting puts all six on one chart, live.

Liquidity

Every limit order waiting to be filled, painted as heat. Bright bands are where big players are parked, and where price tends to react.

Bubbles

Every aggressive market order, sized by volume. Green buyers lifting the offer, red sellers hitting the bid. Big bubbles are big players acting now.

Absorption

Huge selling hits a level and price will not go lower. Someone big is quietly buying everything. It is often where reversals are born.

Spoofing and pulled walls

A giant order that disappears the moment price gets close was never meant to be filled. It was there to scare you. See it vanish, then trade with the real move.

Icebergs

A level that shows a small size but keeps trading far more without breaking. A hidden order is reloading behind it. HeatCharting flags it the moment it happens.

Imbalances

Buyers outnumbering sellers three to one at price after price. Stacked imbalances mark where real initiative started, and they stay on the chart as zones.

One screen for the whole trade.

Read the book, plan the entry, journal the result and talk it over with other traders, without leaving the chart.

Liquidity heatmap

See where the size is.

Resting orders are painted as heat, with history. Walls that hold glow brighter, and walls that vanish as price arrives tell you someone was bluffing. Trade bubbles show every aggressive print.
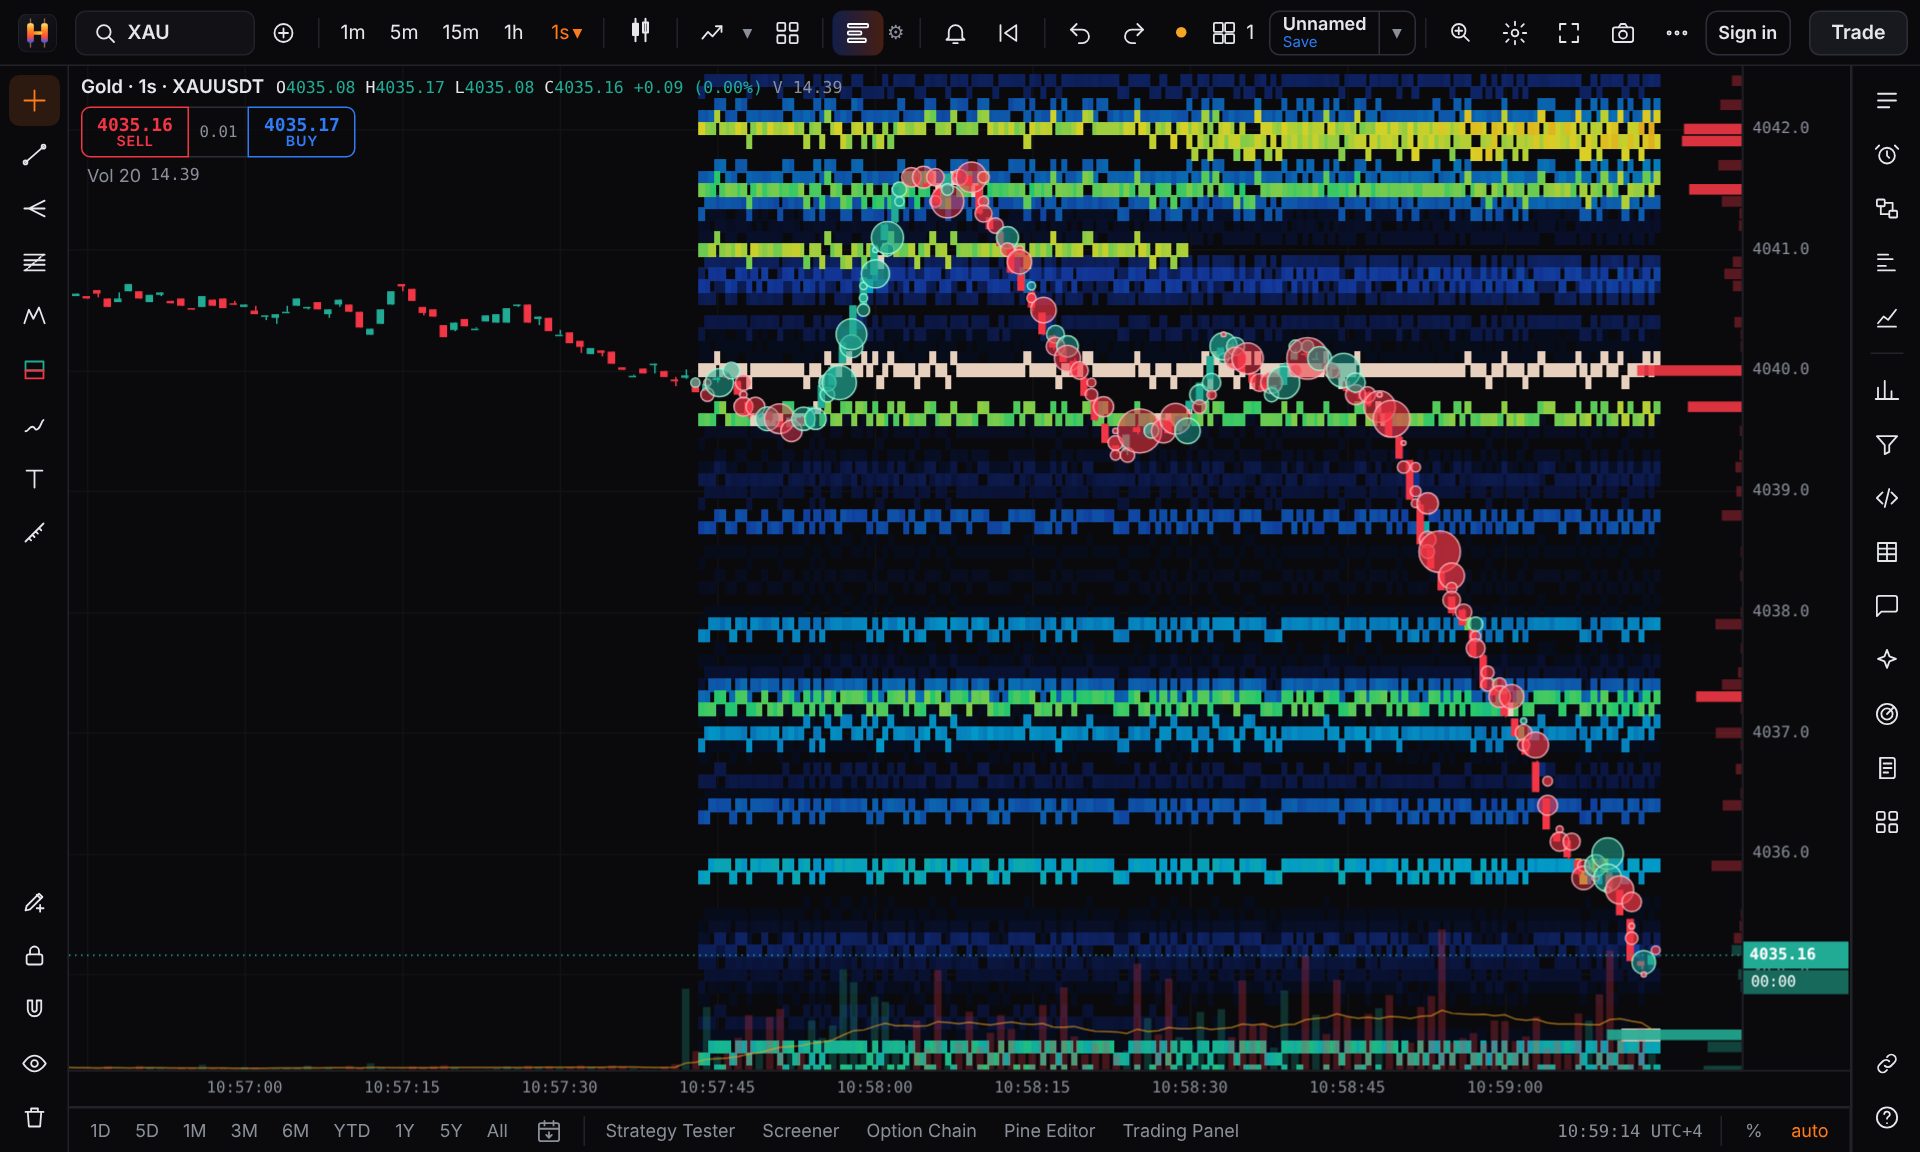
Gold chart with the liquidity heatmap and trade bubbles
Footprint and order flow

Read who is hitting the market.

Bid and ask volume at every price, delta per bar and the point of control. Stacked imbalances stay on the chart as zones until price trades back through them.
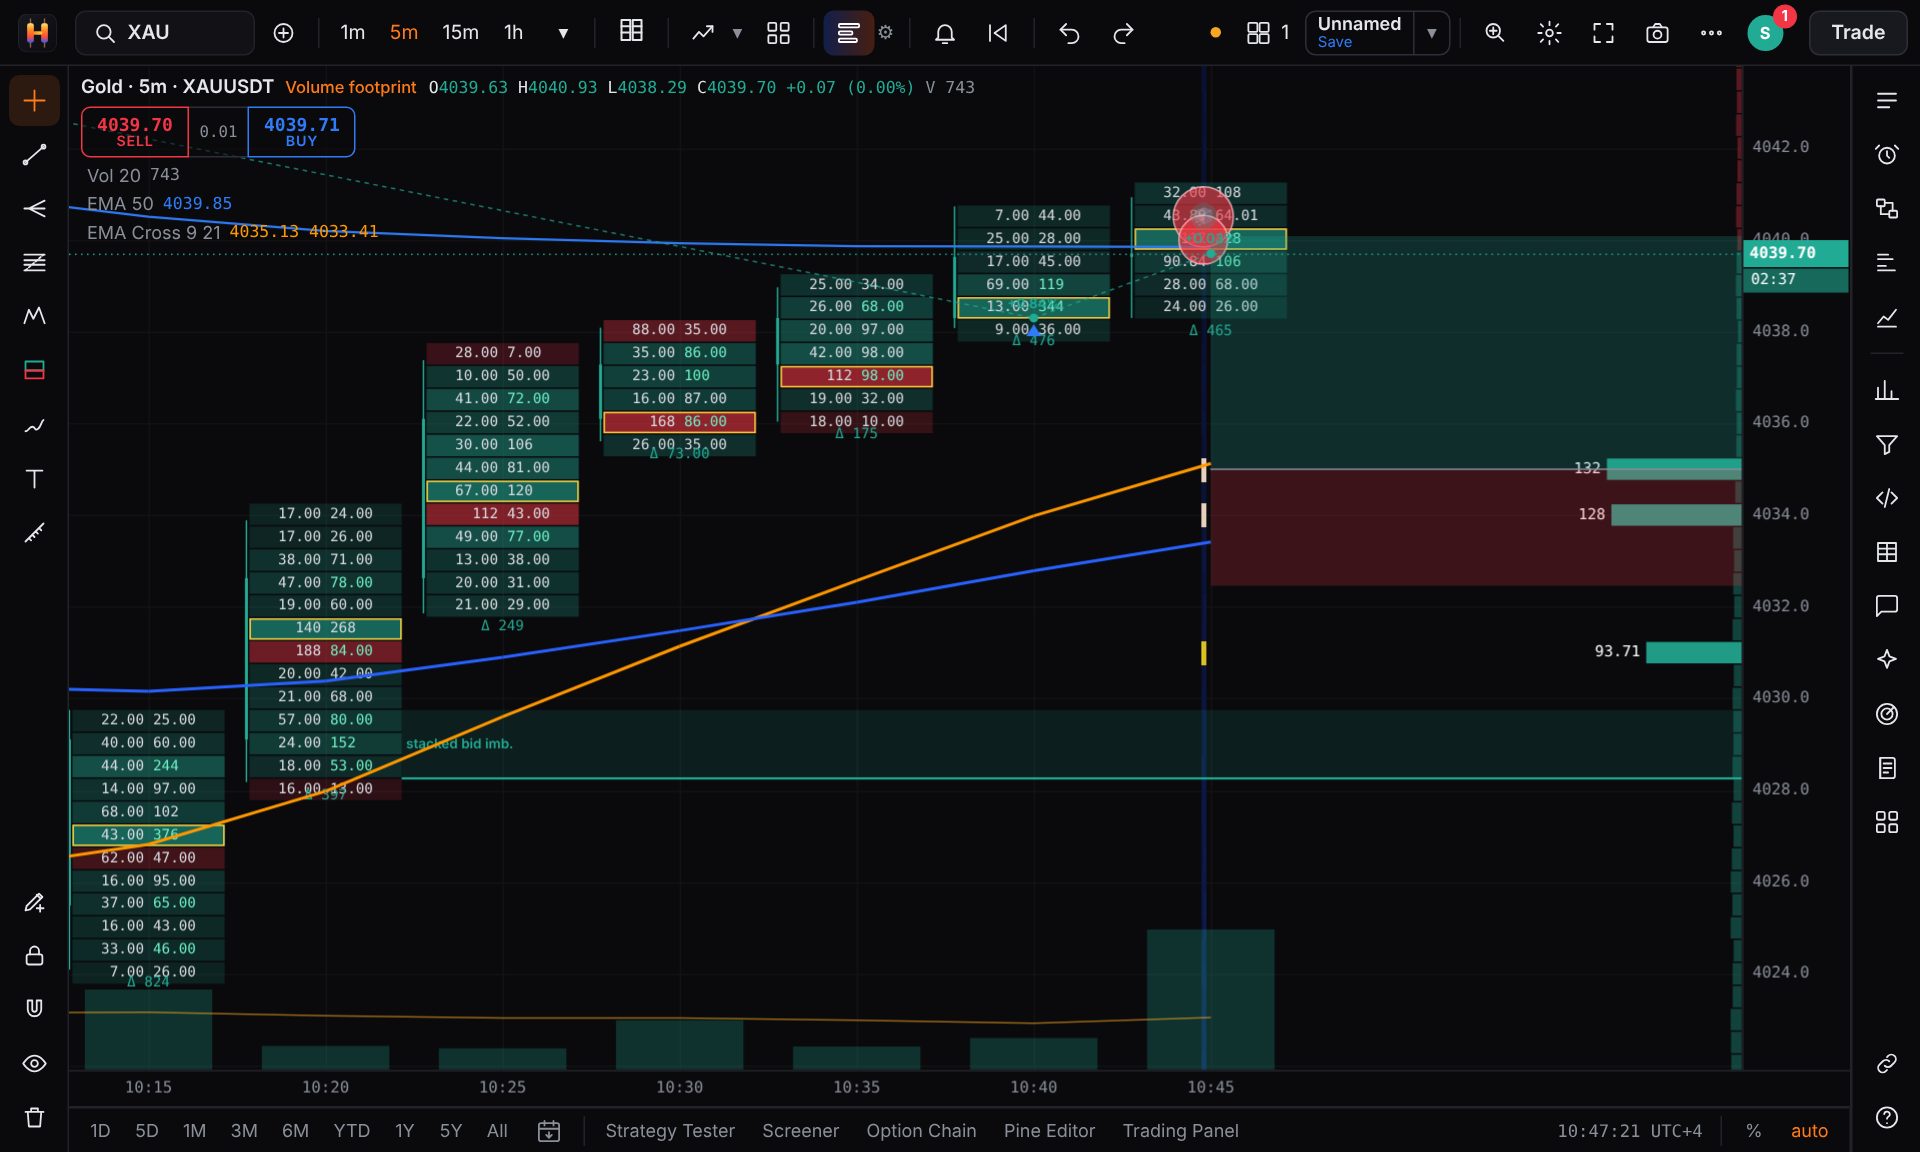
Volume footprint chart
Flow Map

Scan the whole market in one picture.

Every market's 24-hour path funnels into a bull gate and a bear gate, then down to the few setups worth your attention, each with its zone, target and risk-to-reward.
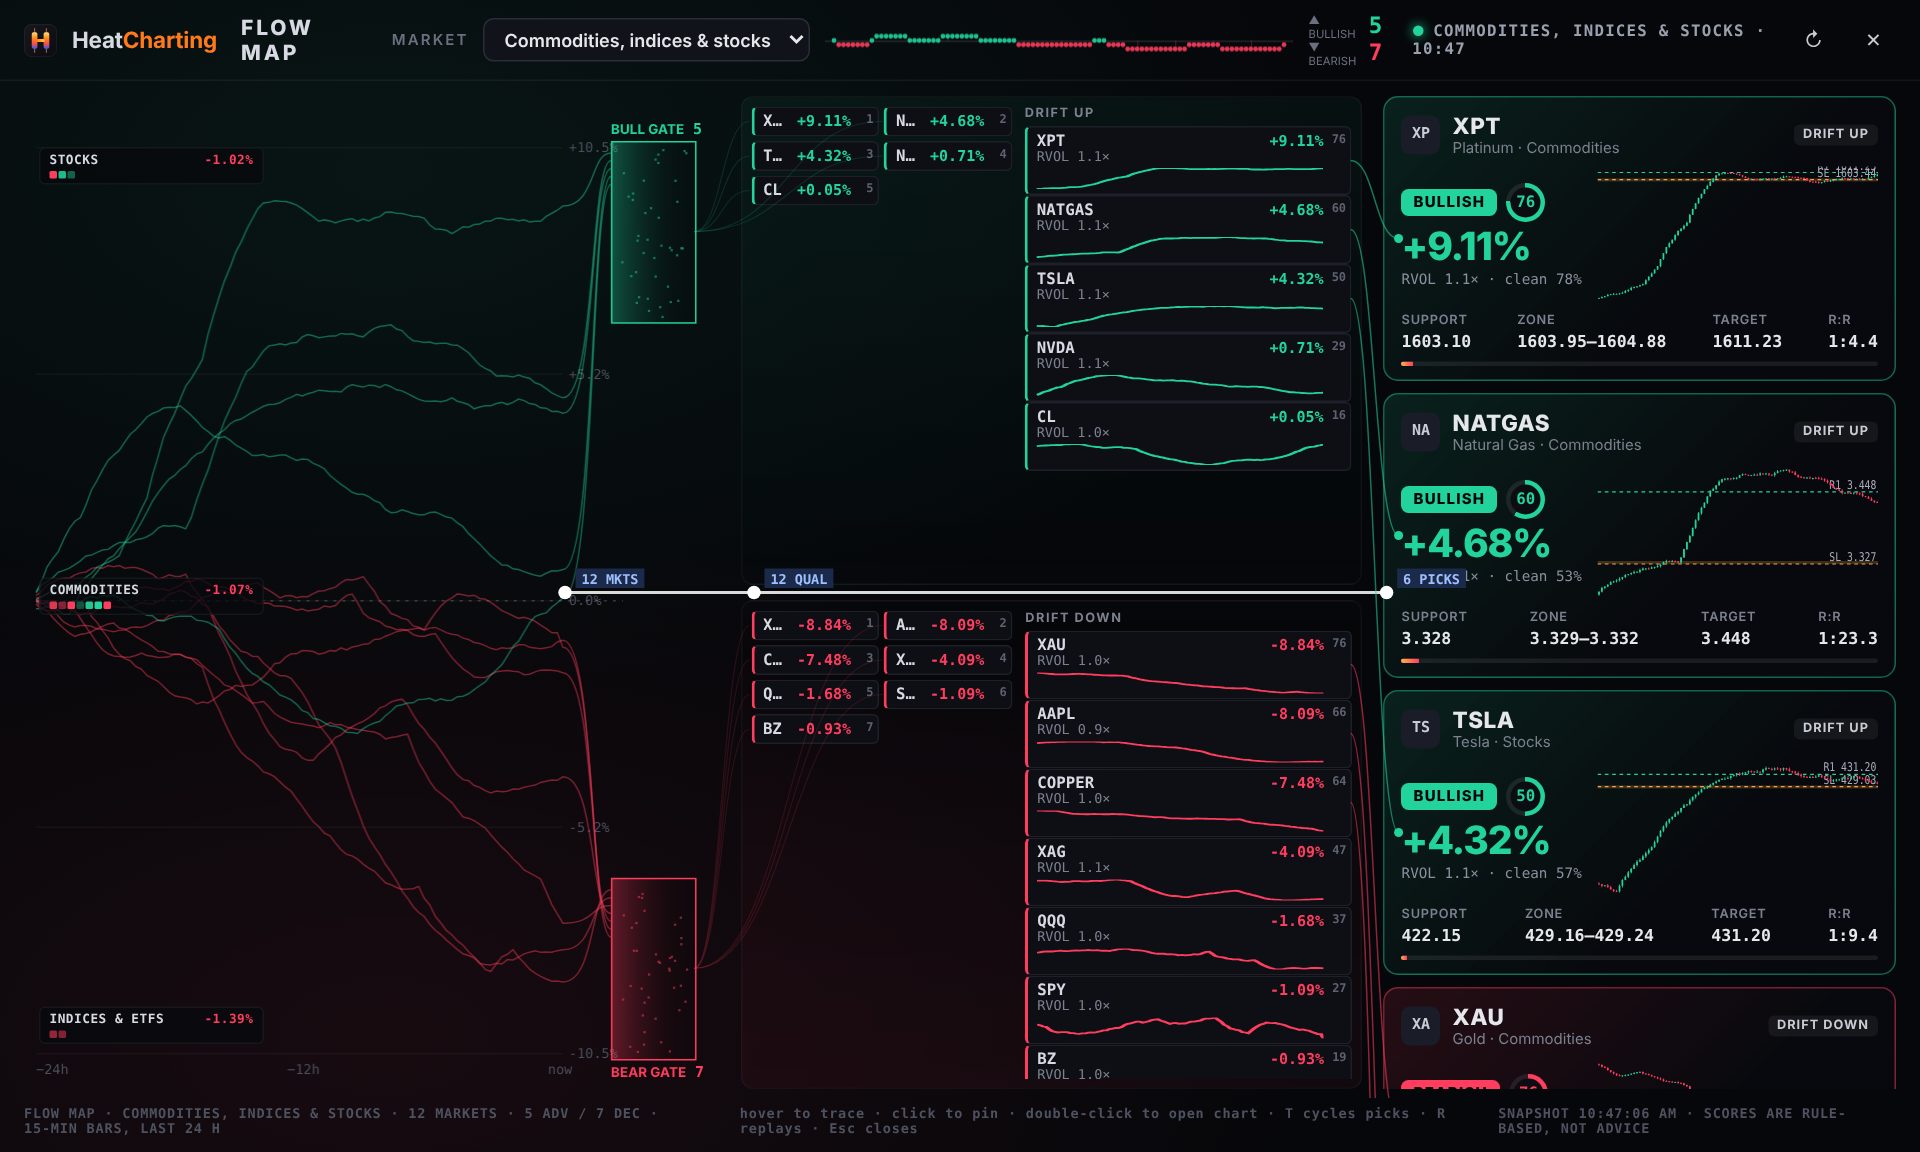
Flow Map funnel of markets into bull and bear picks
Flow Radar

Hear the whales before the candle closes.

Order blocks and fair-value gaps across your watchlist, plus live alerts for whale prints, buying bursts, absorption, icebergs and pulled walls.
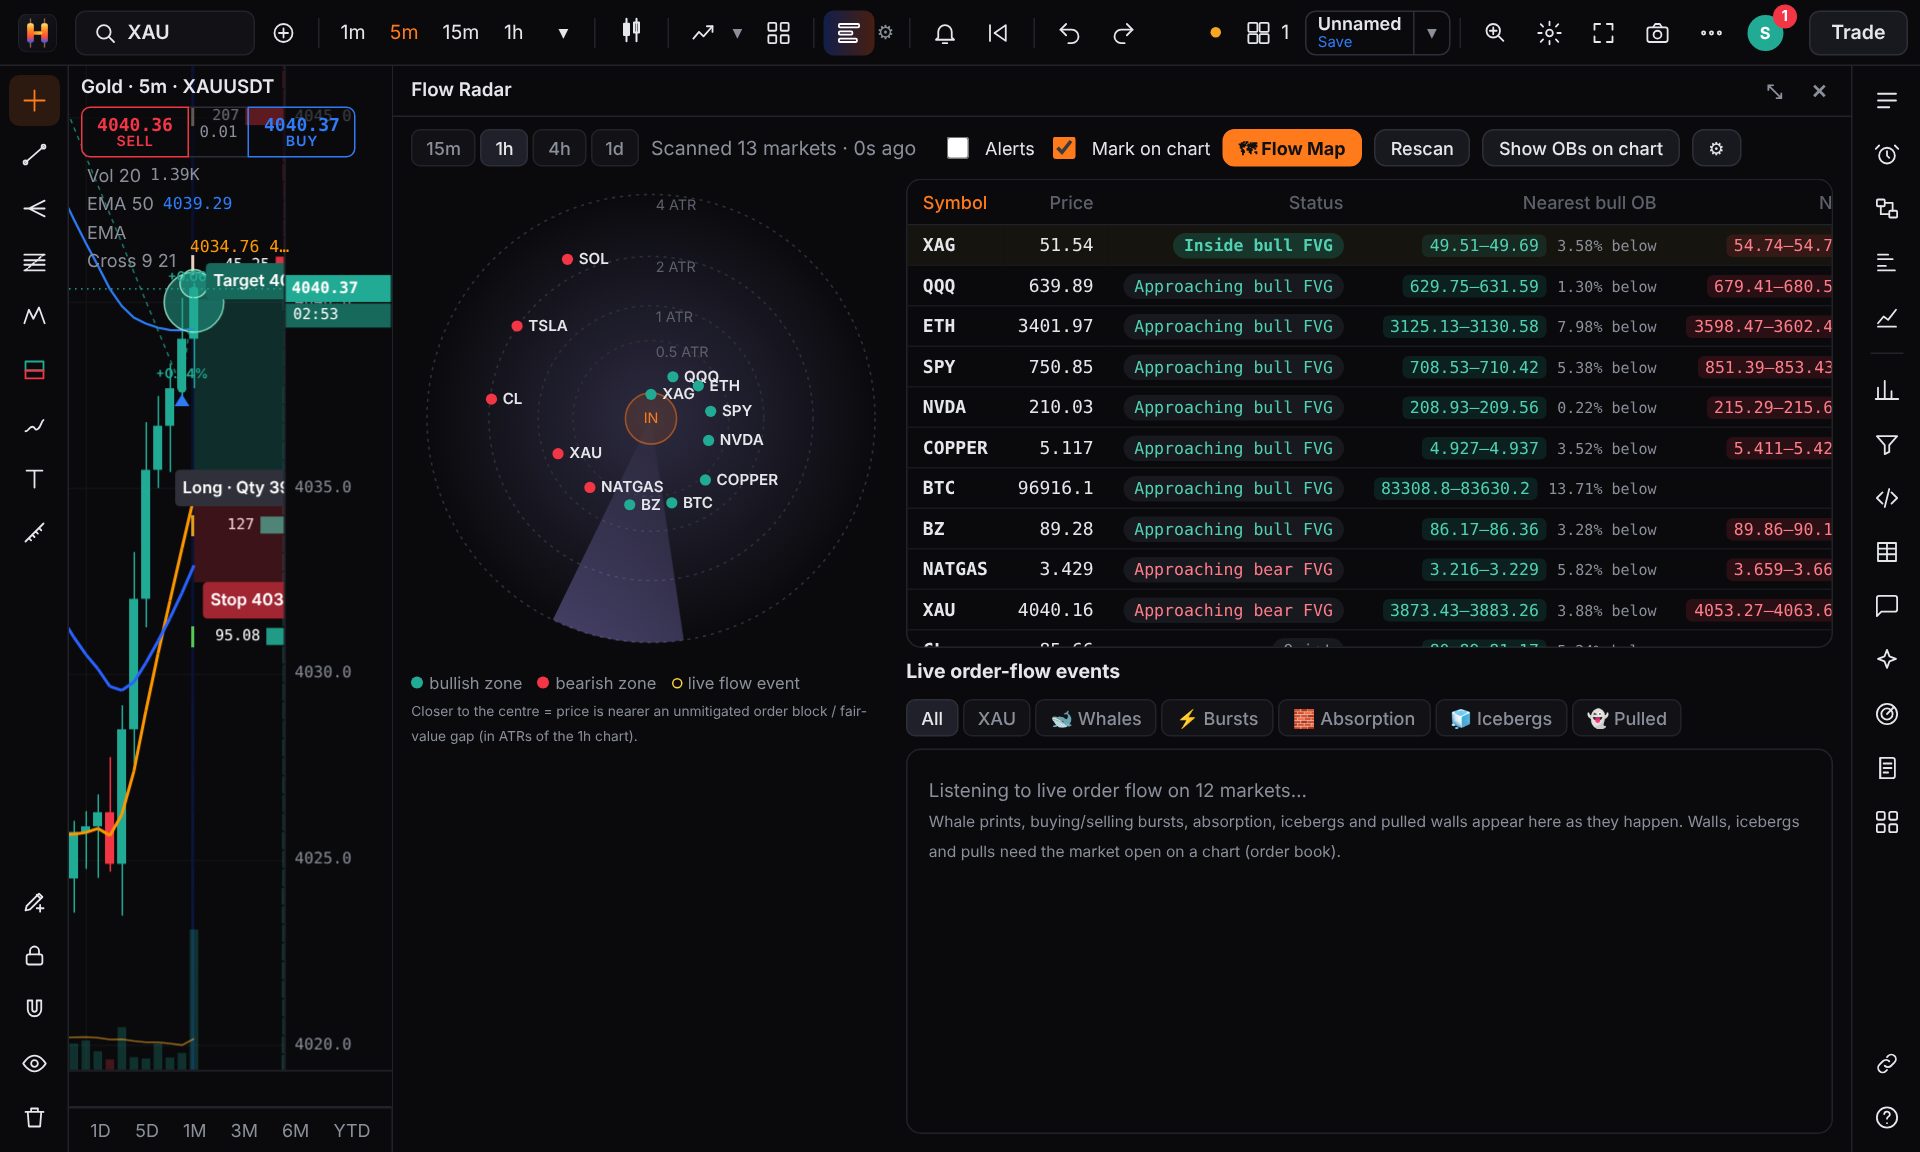
Flow Radar with order blocks across markets
Trade journal

Find out what actually makes you money.

Every trade is logged with a chart screenshot. Tag the setup and how you felt, and the journal shows which setups pay and which habits cost you, with a P&L calendar to keep you honest.
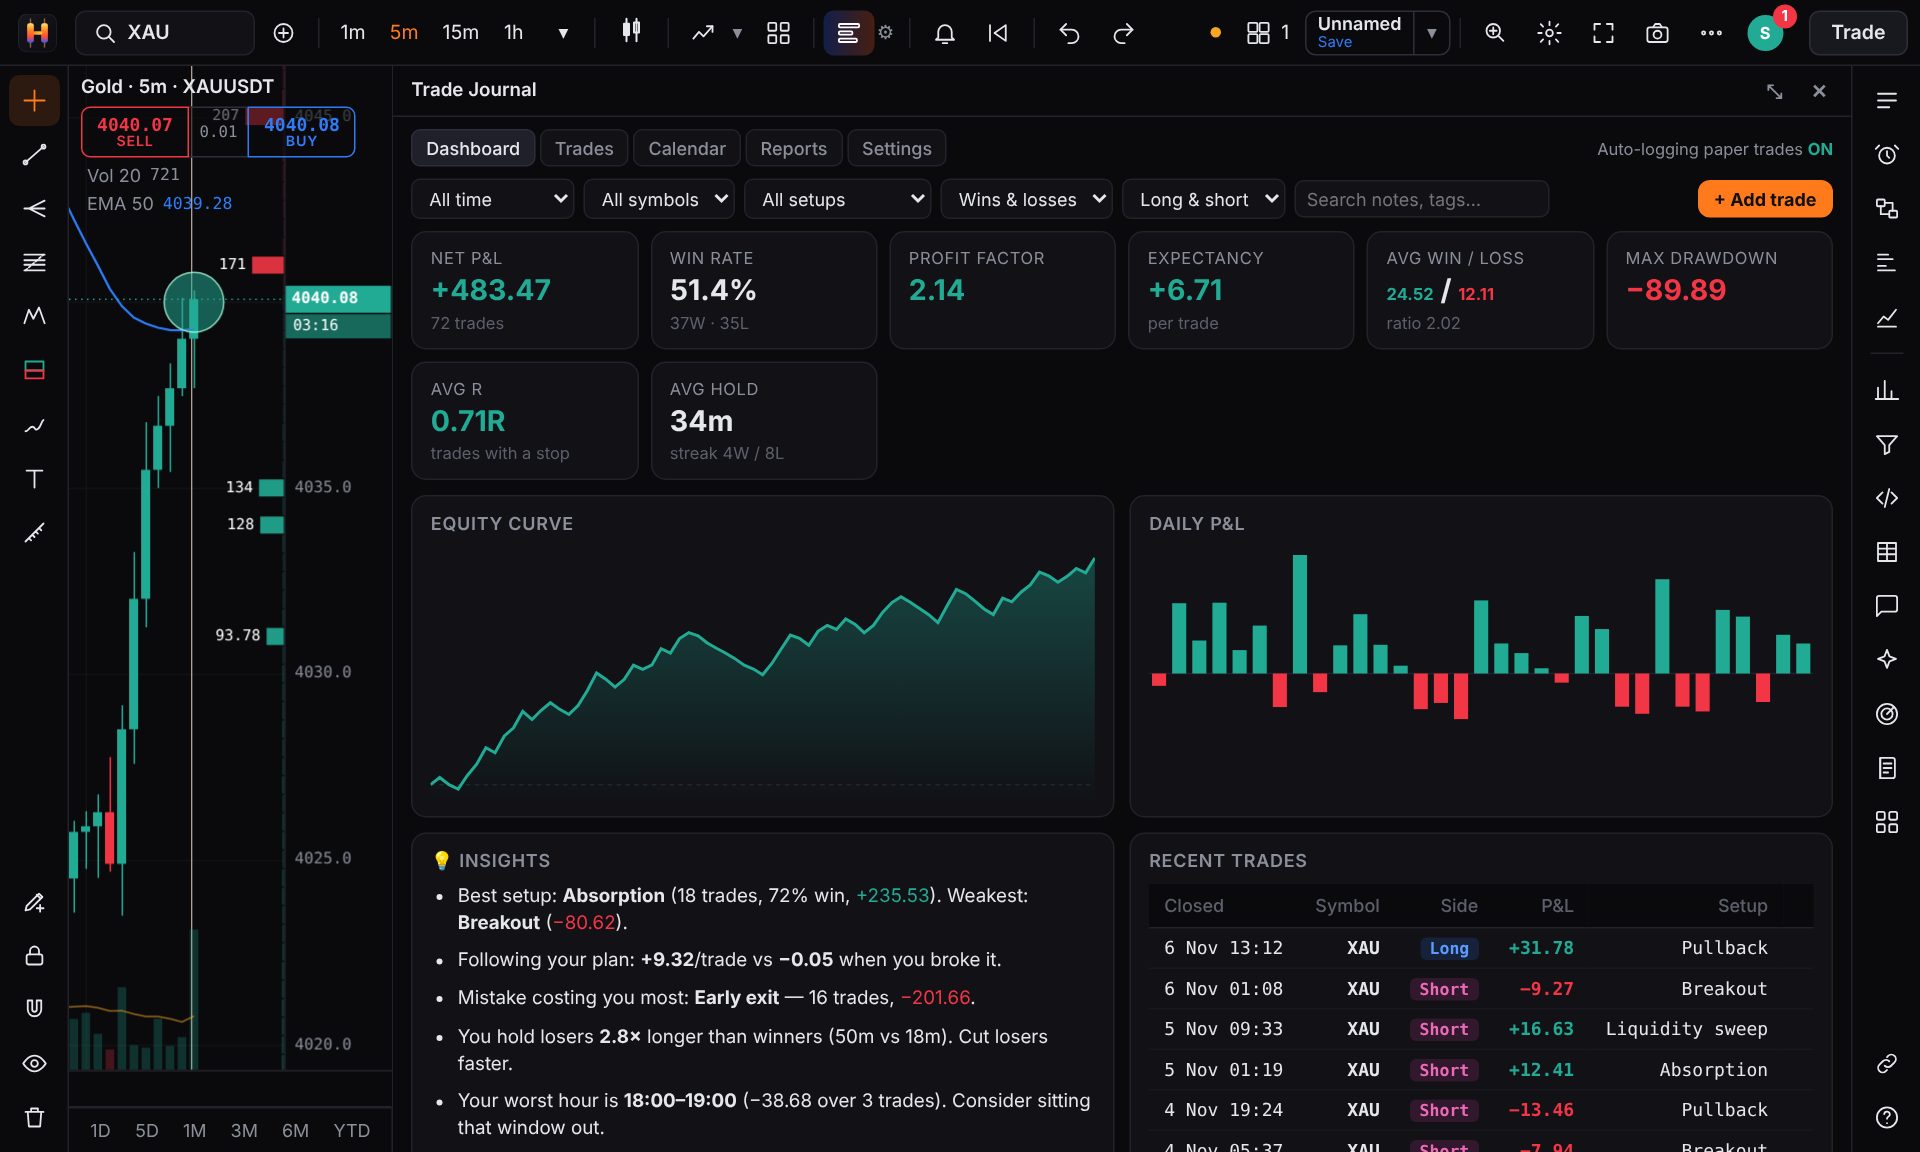
Trade journal dashboard with equity curve and insights
Pine Script

Bring your scripts with you.

Paste a Pine indicator or strategy, plot it on any market and backtest it with a full trade list, profit factor and drawdown.
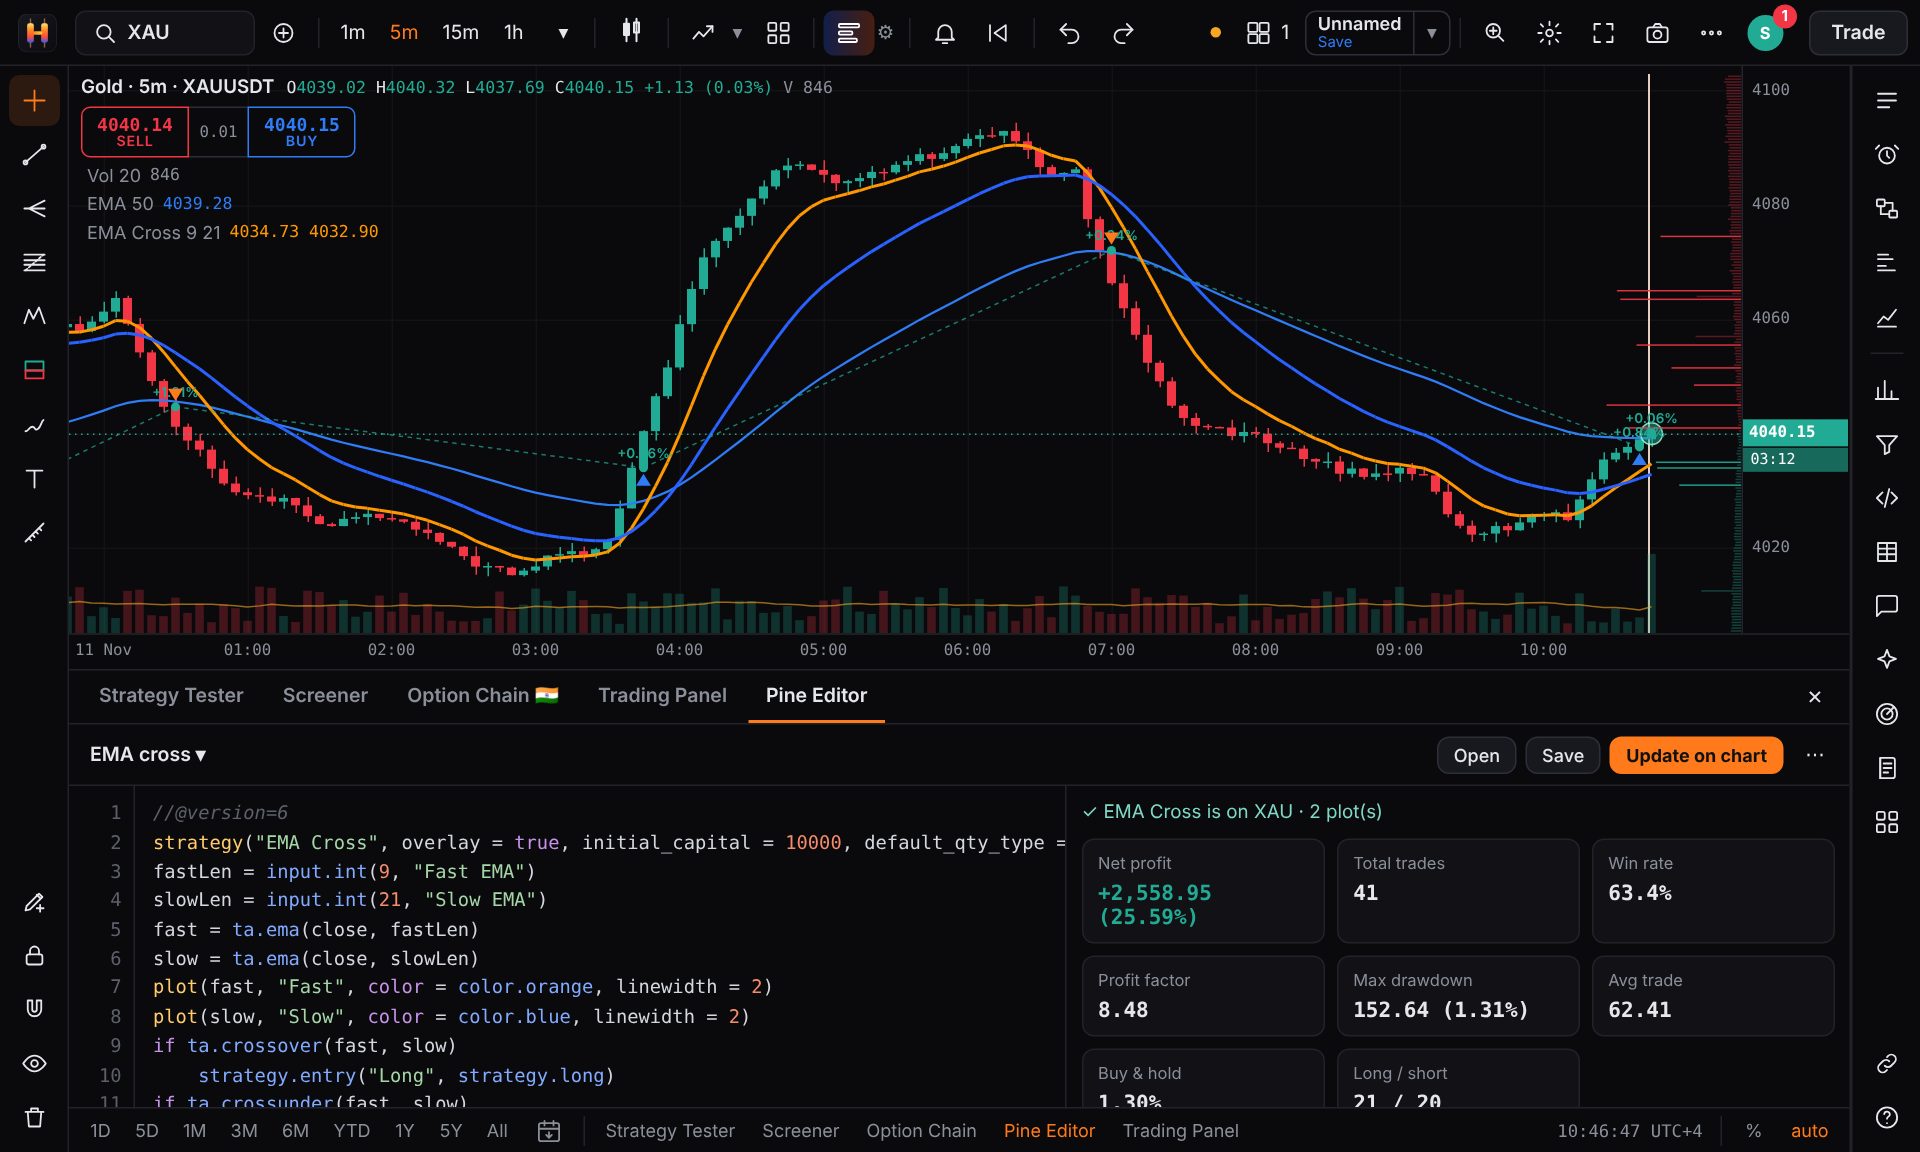
Pine Script editor with a strategy backtest
Super Pilot

Ask for a second opinion.

Your co-pilot reads the structure, the order flow, the economic calendar and your own history on that market, then drafts a plan you can drop straight onto the chart.
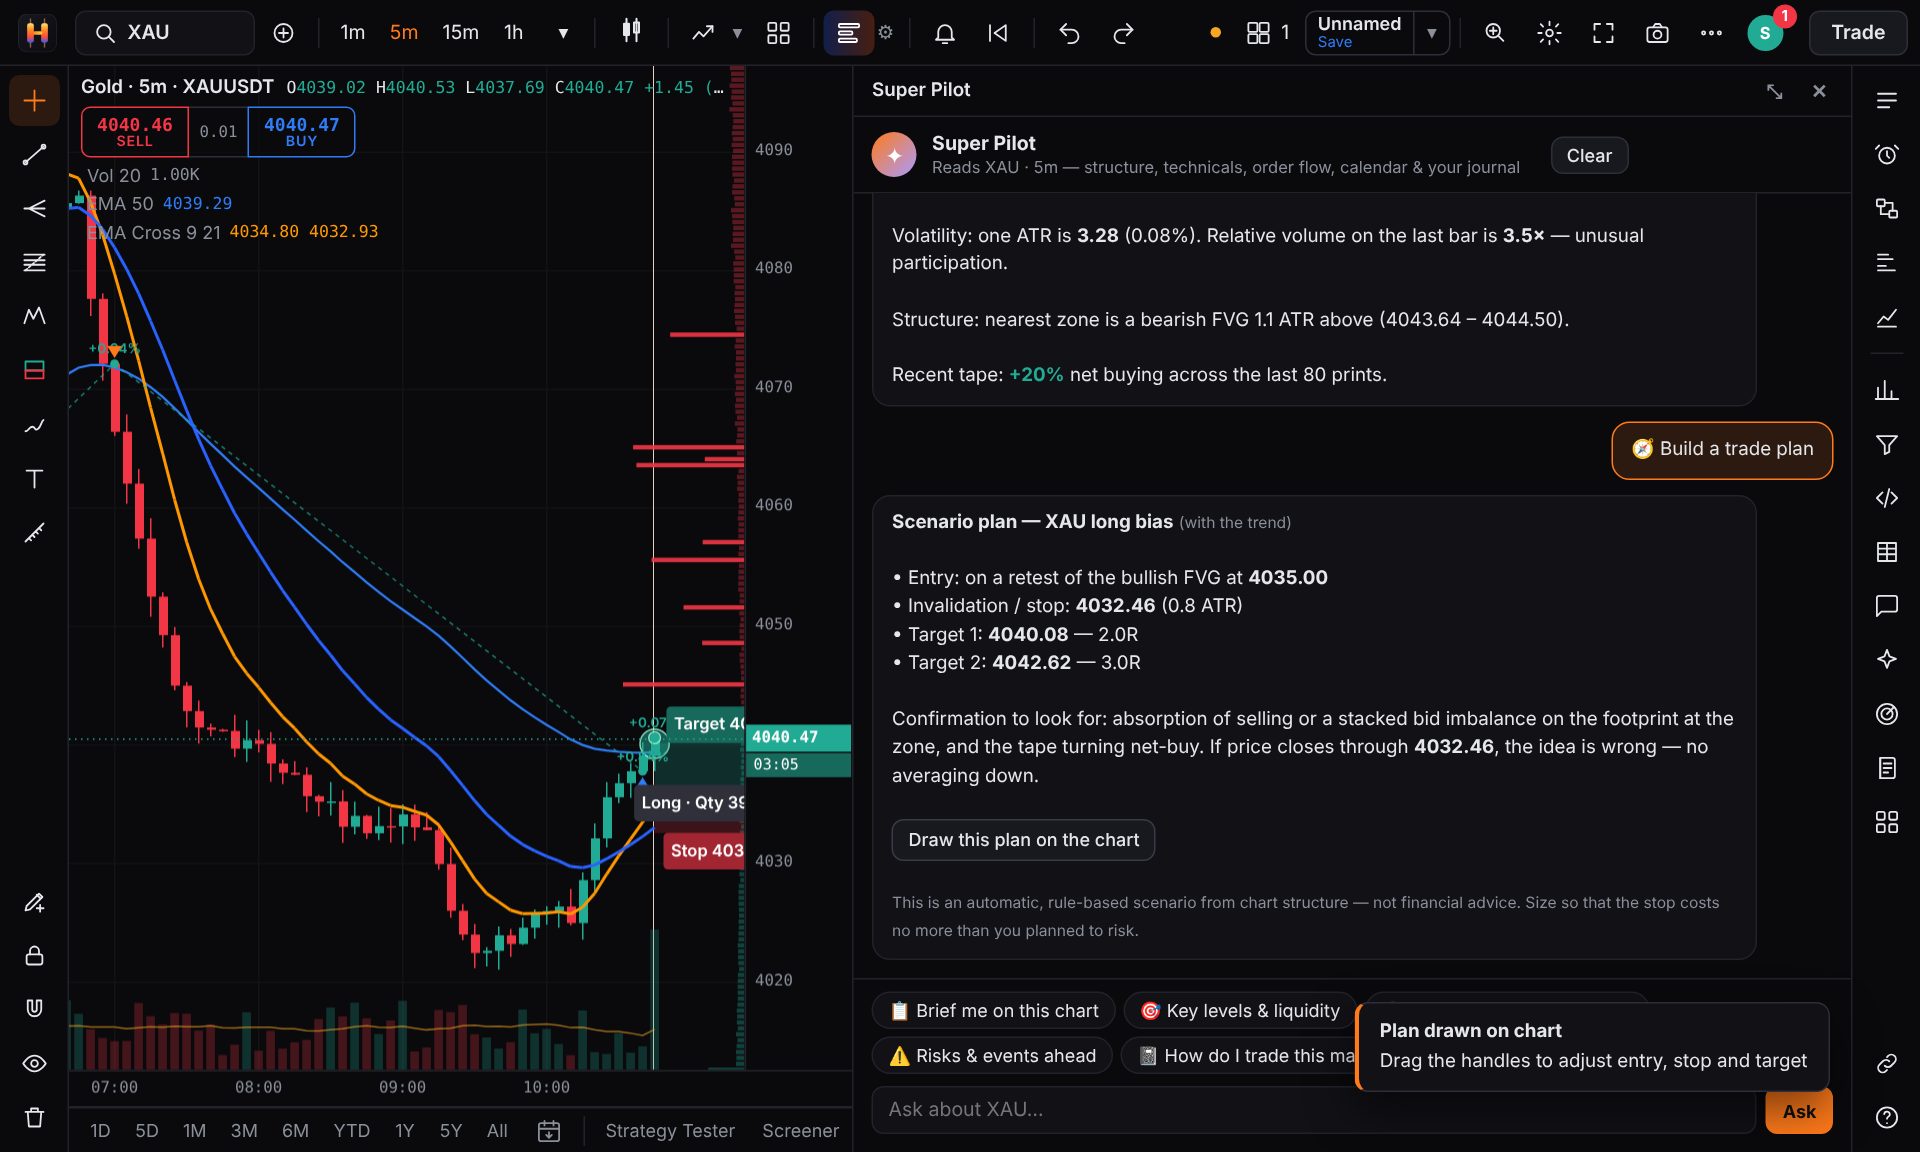
Super Pilot chart brief and trade plan
Community

Share ideas with the chart attached.

Rooms for crypto, Indian markets, gold and order flow, plus direct messages. Anyone can open your exact symbol and timeframe in one click.
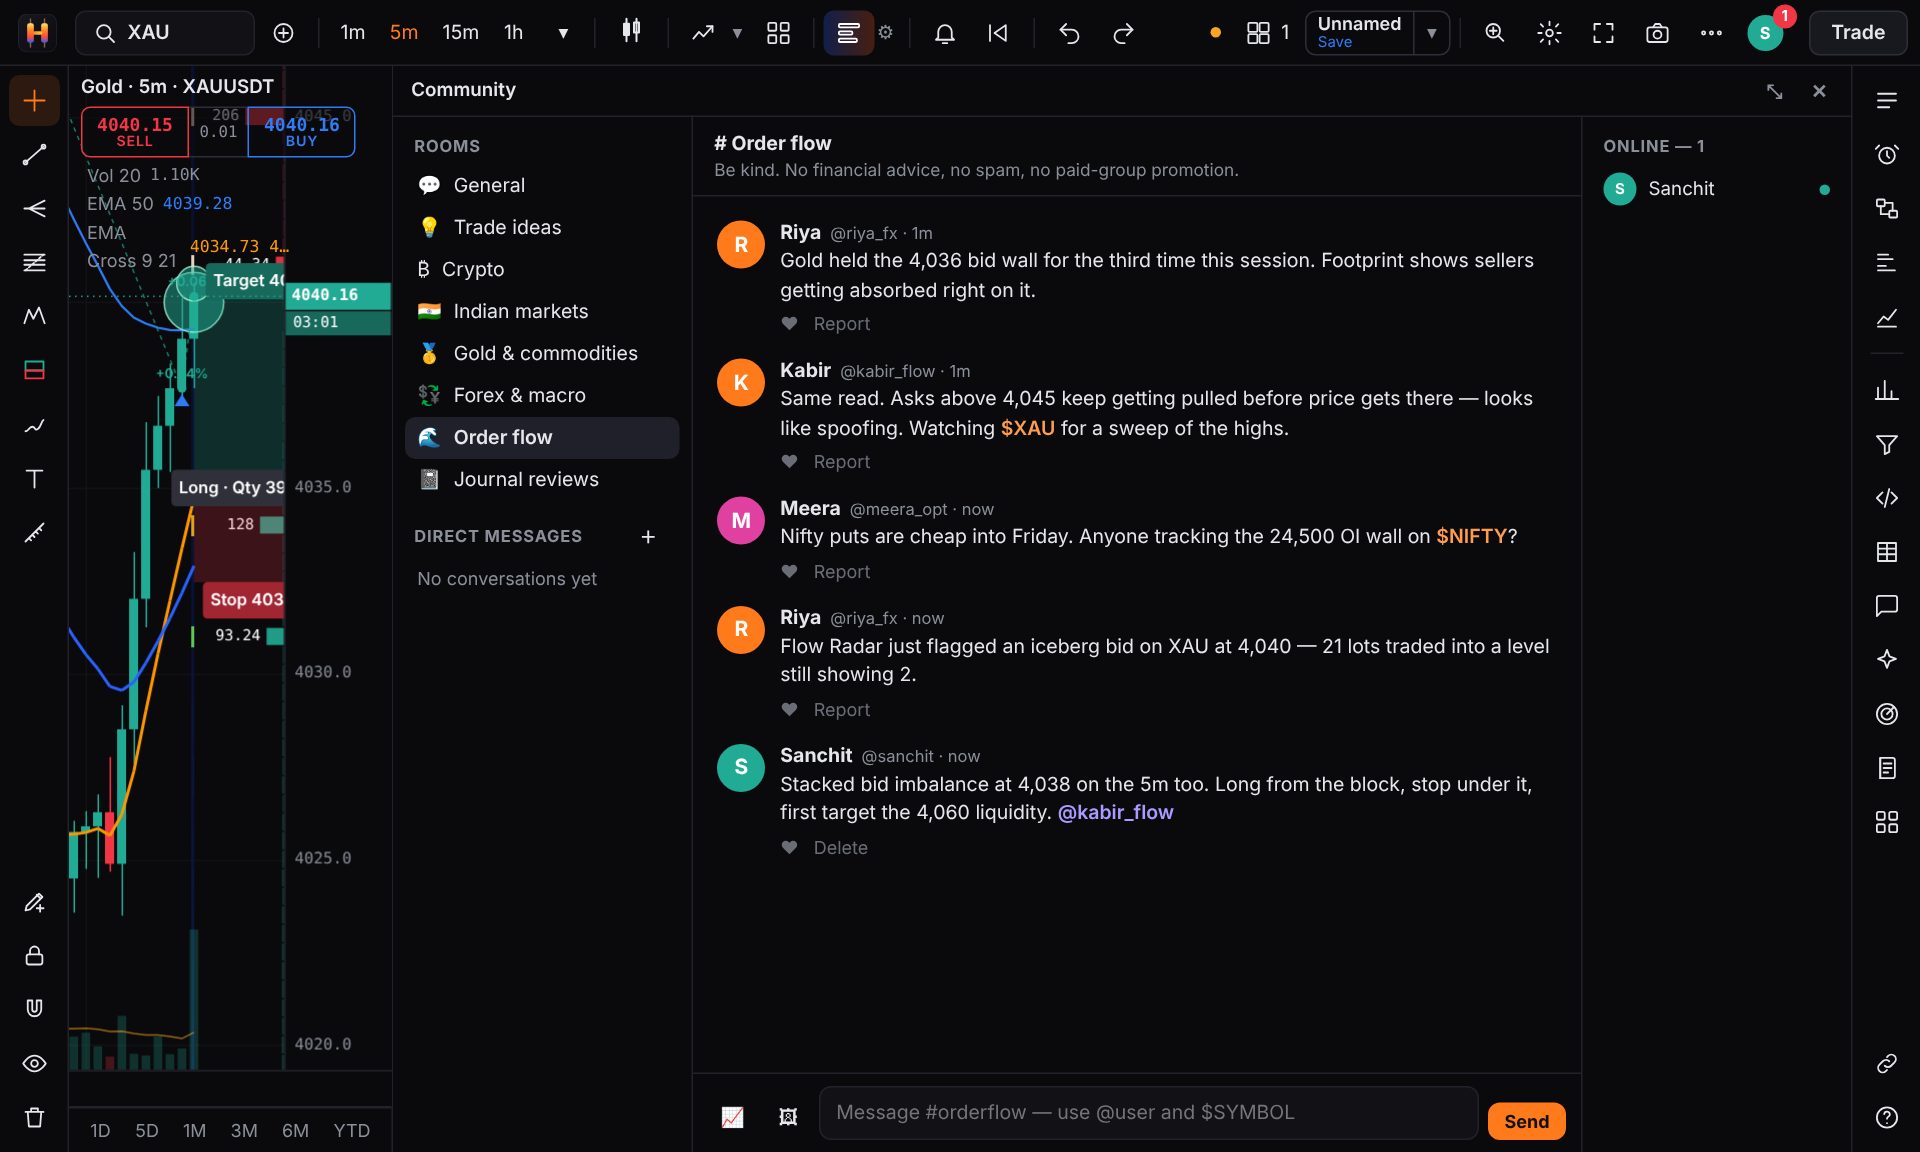
Community order-flow room

And everything you expect from a charting platform.

No plug-ins, no extra subscriptions. It is all in the same window.

61 drawing toolsTrend lines, Fibonacci, Gann, pitchforks, patterns and long/short position tools.
100 indicatorsWith favourites, templates and indicators built on other indicators.
20 chart typesCandles to Renko, Kagi, Point & Figure, TPO and volume footprint.
Up to 16 charts per tabSync the symbol, interval, crosshair and date range across them.
Alerts that never sleepPrice and multi-condition alerts run on the server around the clock, even with your chart closed.
Bar replayPractise any session bar by bar, from slow motion to ten times speed.
Paper tradingDrag entries, stops and targets right on the chart, risk-free.
Strategy testerBuild rules without code or in Pine, and see every trade it takes.
Screener and heatmapsFilter markets by move, volume and range, or see a sector at a glance.
Option chain and builderOI, PCR, max pain, IV and payoff diagrams for Indian options.
Calendar and newsHigh-impact releases and headlines next to the chart they move.
On your phoneThe same charts, with touch to pan and pinch to zoom.

Crypto, commodities, US stocks and India.

One platform for the markets you actually trade, live and streaming.

Crypto

More than 500 crypto markets streaming live, with the full order book behind every chart.

  • BTC
  • ETH
  • SOL
  • Memes
  • AI
  • DeFi

Commodities and US stocks

Gold, silver, oil, gas and copper, the S&P 500, the Nasdaq and US stocks, trading around the clock as perpetuals.

  • Gold
  • Crude
  • Silver
  • NVDA
  • TSLA
  • SPY

India

NSE, BSE, MCX and F&O with 20-level depth, option chains and Nifty 50 maps.

  • Nifty
  • Bank Nifty
  • Sensex
  • F&O
  • MCX

Pay nothing while you trade.

Every new account gets every feature free for 7 days. After that, keep Pro or Elite free by trading through one of our partner brokers, or pay in crypto.

Starter

For learning to read the market

$0

Free forever

  • Charts for crypto, commodities and US stocks
  • 100 indicators and 61 drawing tools
  • Paper trading on the chart
  • Up to 2 charts per tab
  • Community rooms and trader profile
  • Economic calendar and news
Most popular

Pro

For trading order flow every day

Launch offer · 70% off
$97$29/month

or $0 with an active partner broker account

  • Everything in Starter, plus
  • Live liquidity heatmap and trade bubbles
  • Footprint with stacked imbalances
  • Flow Radar: whales, absorption, icebergs, pulled walls
  • Flow Map market funnel
  • Trade journal with screenshots and insights
  • Up to 8 synced charts per tab

Elite

For serious and full-time traders

Launch offer · 70% off
$197$59/month

or $0 with an active partner broker account

  • Everything in Pro, plus
  • Super Pilot chart co-pilot
  • Pine Script strategies and backtests
  • Indian markets through your broker, with 20-level depth
  • Option chain and options builder
  • Up to 16 synced charts per tab
  • Cloud backup of layouts, scripts and journal
How the broker route works. Open an account with a partner broker through our link (Dhan, Fyers, Angel One, Delta Exchange, CoinDCX and more), link your account ID in HeatCharting, and Elite stays free for as long as your account shows trades in the last 30 days. Prefer to pay? Use USDT, BTC, ETH or 100+ other coins, monthly or yearly (save 28%).

Take the order book with you.

HeatCharting apps for Android and iPhone are on the way: the live heatmap, alerts, your journal and the community in your pocket. Create your account now and your layouts will be waiting on your phone.

AndroidComing soon
iPhone & iPadComing soon

Try every feature free for 7 days.

No card and no download. Create your account and the heatmap, footprint, Flow Radar, Super Pilot and Indian markets are all unlocked from the first minute.

Start your free trial

Already have one?

We will email you a 6-digit code to confirm your address.

Welcome back

Sign in to your HeatCharting account.

New here?